WTI Price Analysis: Fades bounce off multi-day-old support near $78.00
- WTI struggles to keep the previous day’s rebound from eight-month low.
- Sustained trading below key Fibonacci retracement level, downbeat oscillators favor bears.
- One-month-old descending resistance line adds to the upside filters.
WTI crude oil prices retreat to $78.00, after bouncing off the lowest levels since early January, as bears keep the reins during early Wednesday.
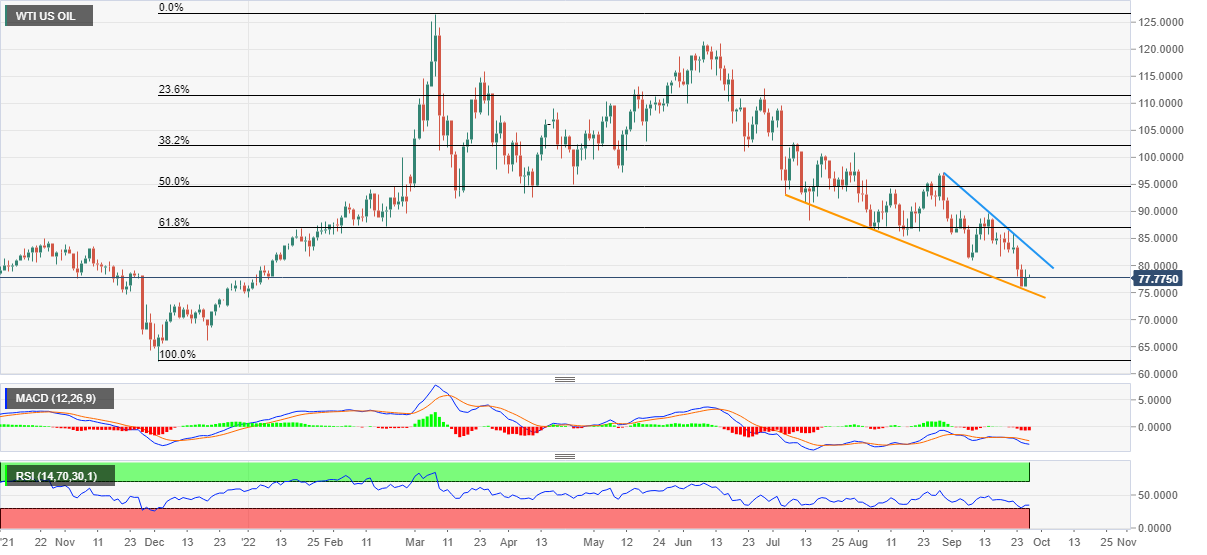
In doing so, the black gold justifies bearish MACD signals and the downbeat RSI while reversing the jump from the downward sloping support line from early July. Also keeping the commodity sellers hopeful is the sustained trading below the 61.8% Fibonacci retracement level of December 2021 to March 2022 upside, near $87.00.
That said, the quote is likely to retest the aforementioned support line, close to $75.20 at the latest.
Following that, the early December 2021 peak surrounding $73.20-15 could challenge the WTI bears before directing them to the previous key trough of $62.34.
Meanwhile, recovery moves remain elusive until staying below the monthly resistance line, around $83.40 at the latest.
Even so, the 61.8% golden ratio near $87.00 could challenge the oil buyers ahead of giving them control.
In that case, the late August swing high near $97.30 and the $100.00 psychological magnet will be in focus.
WTI: Daily chart
Trend: Bearish