GBP/USD Price Analysis: On the verge of a downside breakout, awaits US inflation
- GBP/USD drops for the third straight day, attacks 1.4100.
- The cable is on the verge of a rising channel breakdown on the daily chart.
- Focus remains on US inflation, ECB and Thursday’s closing.
GBP/USD is attacking the 1.4100 support, eyeing deeper losses, as the sellers remain in control amid a broadly firmer US dollar.
Brexit concerns and the UK reopening anxiety also remain a drag on the cable, as the attention turns towards the highly-anticipated US CPI and ECB policy decision this Thursday.
From a near-term technical perspective, the spot is on the verge of a downside breakout from a rising wedge formation if it closes the day below the rising trendline support at 1.4103.
The next relevant support for GBP bulls is seen at the psychological 1.4000 levels, below which the ascending 50-daily moving average (DMA) at 1.3994 could be tested.
The abovementioned level is critical, as the bullish 21-simple moving average (SMA) coincides.
GBP/USD daily chart
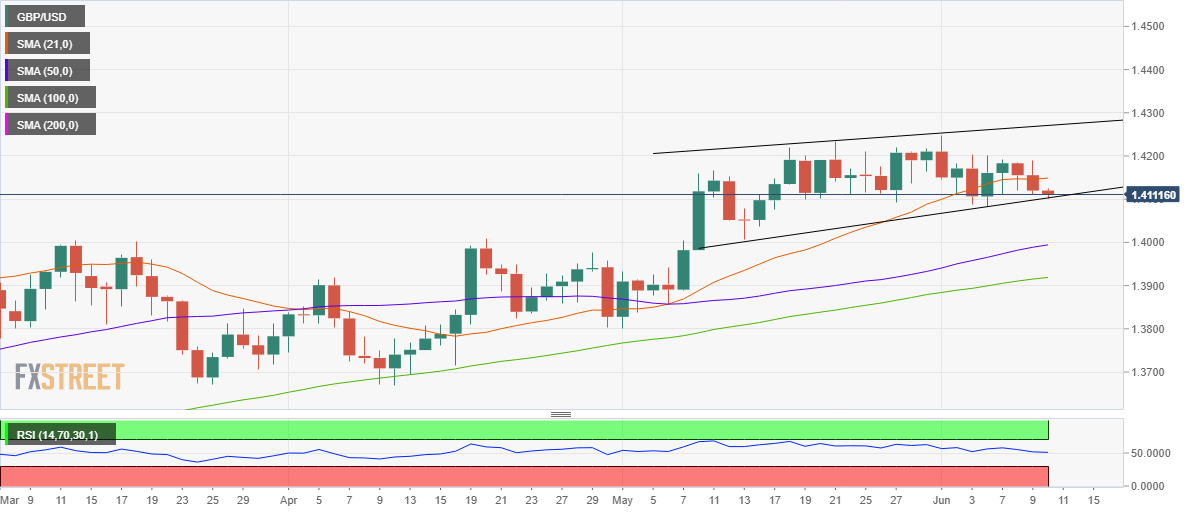
However, with the Relative Strength Index (RSI) is turning flat above the midline, currently, at 50.95, the odds for a rebound towards the 21-DMA at 1.4148 remain in place.
Acceptance above the latter will negate the downside bias in the near term, opening doors towards the pattern resistance aligned at 1.4270.
Ahead of that level, the intermittent highs around 1.4190 could limit the recovery attempts.
GBP/USD additional levels to watch