USD/CAD Price Analysis: Corrective pullback fizzles below short-term resistance lines
- USD/CAD steps back from a three-week-old trend line resistance.
- Normal RSI conditions suggest further weakness.
- An eight-day-long falling resistance line add to the upside filters.
USD/CAD justifies the strength of a descending resistance line from November 23 while easing to 1.2762 during the early Asian session on Tuesday. The absence of extreme RSI conditions also suggests a continuation of the current pullback moves.
As a result, the recent lows near 1.2720, followed by the 1.2700 round-figure, regain USD/CAD sellers’ attention.
However, any further downside past-1.2700 will not hesitate to challenge the initial 2020 troughs surrounding 1.2630.
On the flip side, a clear break of the stated resistance line, at 1.2771 now, will have to cross another falling trend line from December 03, currently, around 1.2795, to recall the USD/CAD buyers.
It’s worth mentioning that the pair’s sustained run-up beyond 1.2795 needs validation from the 1.2800 threshold to eye for 1.2830 and the 1.2880/85 numbers to the north.
USD/CAD four-hour chart
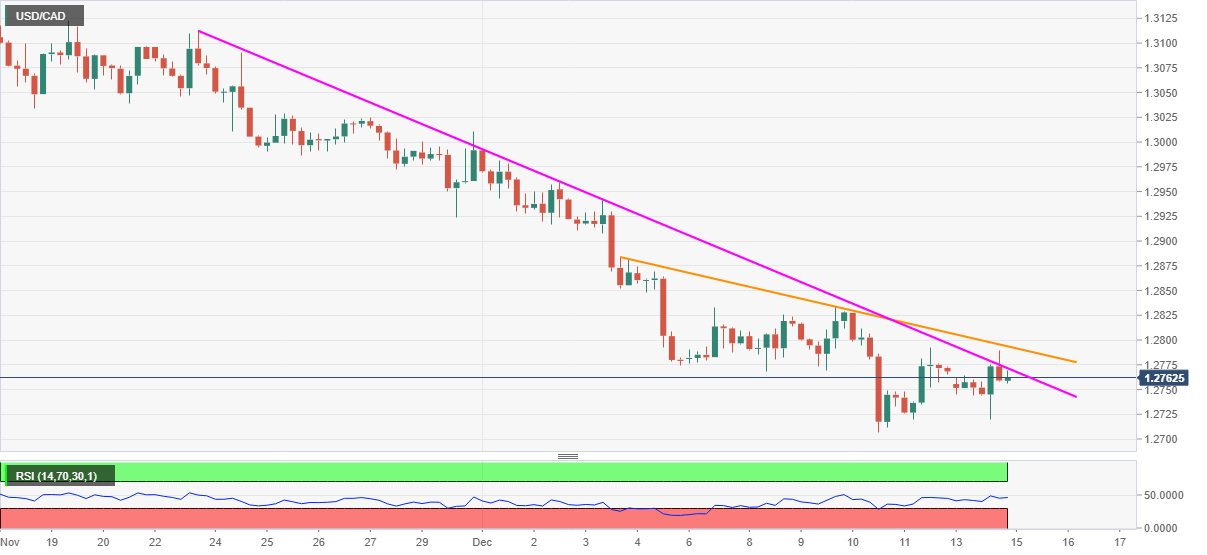
Trend: Bearish