21 Oct 2020
US Dollar Index Price Analysis: Extra losses expected below 92.70
- DXY tumbles further to multi-week lows near 92.70.
- Below this area comes in the Fibo level at 91.92.
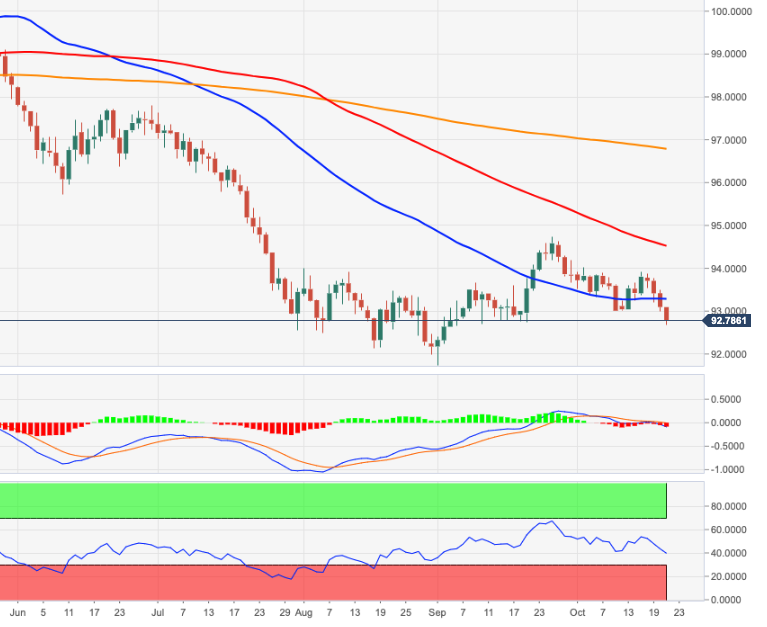
DXY accelerates the leg lower following the recent breakdown of the key support at 93.00 the figure, printing fresh multi-week lows in the 92.70/65 band.
A deeper pullback now threatens to drag the dollar to the sub-92.00 area, where sits a Fibo level (of the 2017-2018 drop). If sellers push further, then a visit to the 2020 low at 91.74 (September 1) should emerge on the horizon.
While below the 200-day SMA, today at 96.77, the negative view on the dollar is expected to persist.
DXY daily chart