14 Sep 2020
GBP/JPY Price Analysis: Bullish RSI divergence on 4H chart
- GBP/JPY trades in the green above 136.00 with bullish signals on the 4-hour chart.
- A corrective bounce to a key SMA hurdle looks likely.
GBP/JPY is currently trading at 136.05, representing a 0.20% gain on the day, having hit a low of 135.44 early Monday.
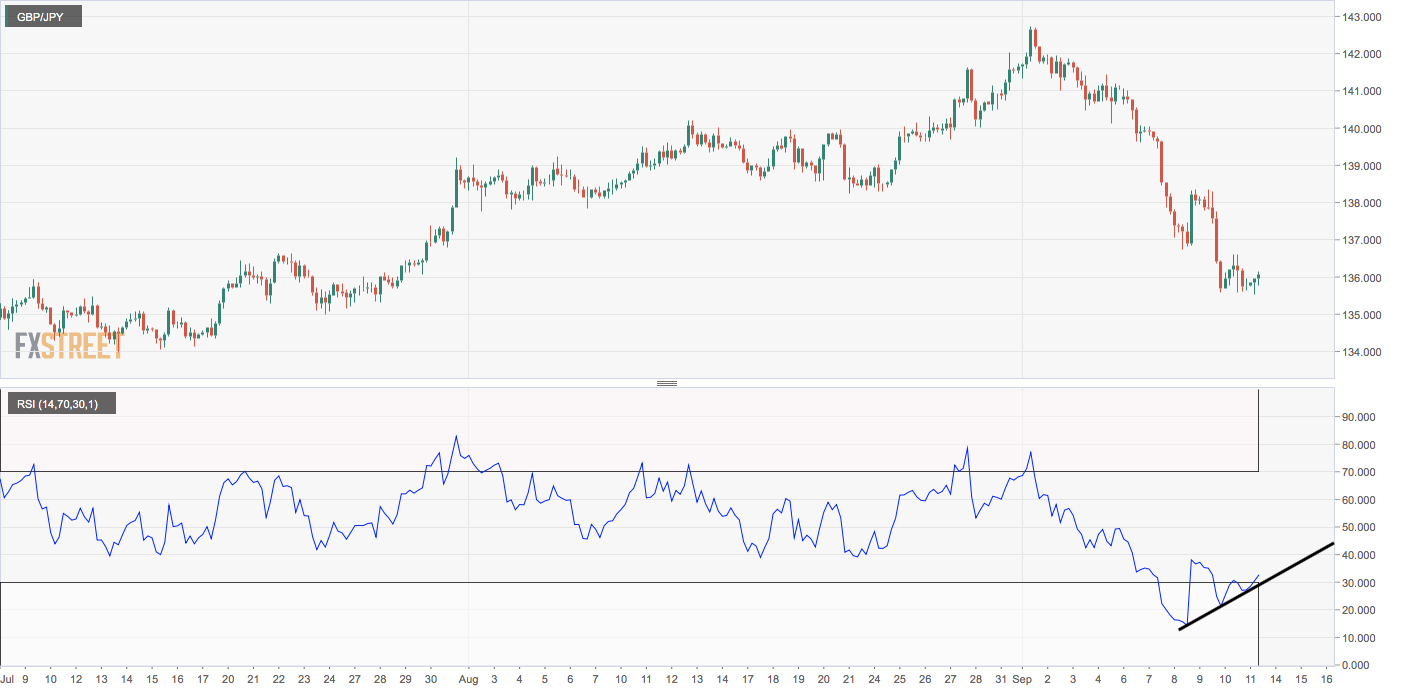
The 4-hour chart now shows a bullish divergence of the relative strength index, a sign of downtrend exhaustion. Further, the MACD histogram has crossed into bullish territory above 50. The hourly chart RSI has also diverged in favor of the bulls.
As such, the pair looks set to challenge the descending 5-day simple moving average (SMA), currently at 136.67. A violation there would expose the 50-day SMA lined up at 137.80.
The overall bias would remain bearish as long as the pair is held below the 10-day SMA, currently at 138.87. On the downside, 133.98 (July 14 low) is major support.
Daily chart
Trend: Corrective bounce