GBP/USD Price Analysis: 1.2400 guards immediate upside
- GBP/USD struggles to find traction after a three-day winning streak.
- A confluence of short-term key SMAs restricts immediate upside.
- Sellers wait for entry below the three-week-old support line.
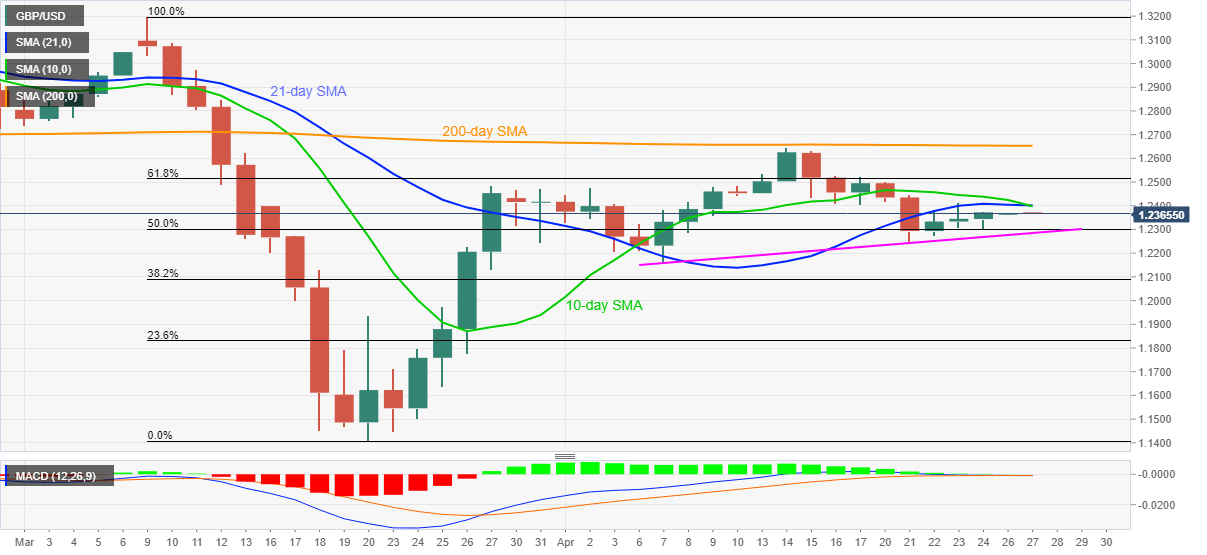
GBP/USD stays depressed around 1.2365 during the early Asian session on Monday. In doing so, the Cable remains below a confluence of 21-day and 10-day SMA while staying above 50% Fibonacci retracement of March month downside.
Not only the pair’s trading between the key technical levels but a lack of direction from MACD also suggests the traders’ indecision.
It should also be noted that in addition to the 50% Fibonacci retracement level, near 1.2300, an upward sloping trend line since April 07, around 1.2285, also adds to the pair’s downside support.
Should GBP/USD prices slip below 1.2285, challenges to the monthly low near 1.2165 can’t be ruled out.
On the contrary, an upside clearance of 1.2400 resistance confluence on a daily closing basis will have to clear 61.8% Fibonacci retracement level of 1.2515 before pushing the buyers towards 200-day SMA level of 1.2655.
GBP/USD daily chart
Trend: Sideways