11 Jun 2019
Oil technical analysis: WTI is under pressure below $54.30 a barrel
- WTI remains under selling pressure.
- 53.00 and 52.00 can be targets to the downside.
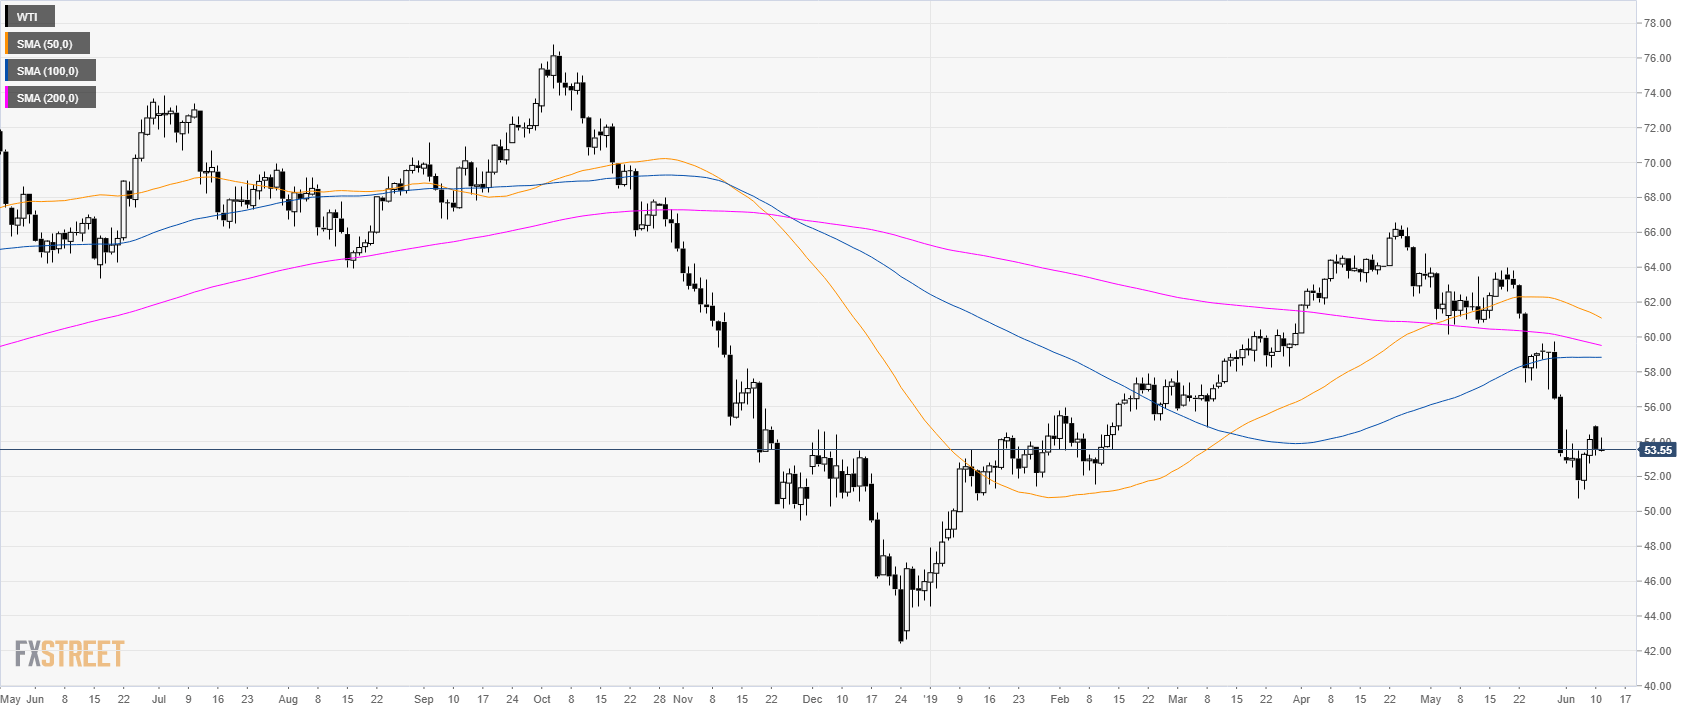
Oil daily chart
WTI (West Texas Intermediate) is under bearish pressure below $55.00 a barrel and its main simple moving averages (SMAs).
Oil 4-hour chart
WTI is trading below the main SMAs suggesting a bearish bias. The path of least resistance is to the downside and sellers can push the market towards 53.00 and 52.00 figure. Resistance is seen at 54.30 and 55.00 level.
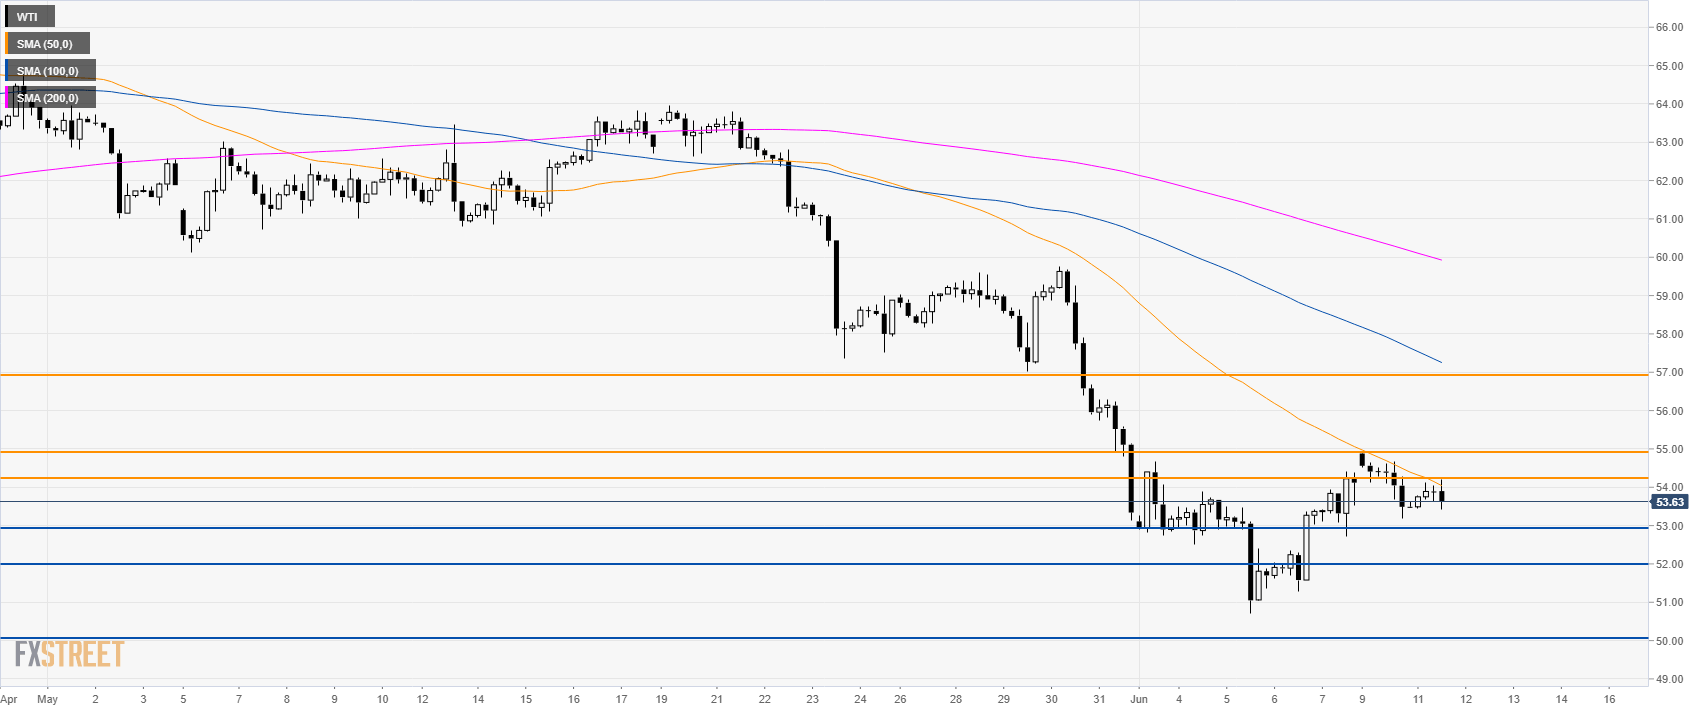
Additional key levels