30 Aug 2018
EUR/JPY Technical Analysis: The cross has been rejected from the resistance line above 130.00
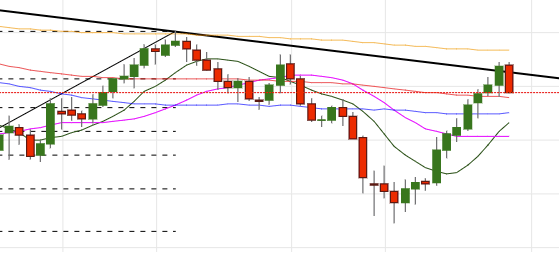
- The upside momentum around the cross met a tough barrier at the multi-month resistance line near 130.80, sparking a the current leg lower to sub-130.00 levels.
- A surpass of this resistance line is needed to allow a continuation of the rally to levels above 131.00 the figure, where are located early August peaks and the key 200-day SMA.
- The re-emergence of the selling bias should send spot to meet its initial support at the 129.00 neighbourhood, where coincide late July’s low, the 38/2% Fibo retracement of the May-July up move and the 55-day SMA.
- Further south, the 21-day SMA awaits at 128.11.
EUR/JPY daily chart
Daily high: 130.88
Daily low: 129.68
Support Levels
S1: 129.92
S2: 129.10
S3: 128.62
Resistance Levels
R1: 131.22
R2: 131.70
R3: 132.52