18 Jun 2018
EUR/JPY Technical Analysis: Bears on the offensive as US-China trade war fears rise
- The EUR/JPY hourly chart shows a bear flag breakdown - a bearish continuation pattern, which indicates the sell-off from the high of 130.36 has resumed.
- The JPY is solidly bid in Asia on escalating US-China trade tensions and could extend gains further on escalating US-China trade tensions.
Hourly chart
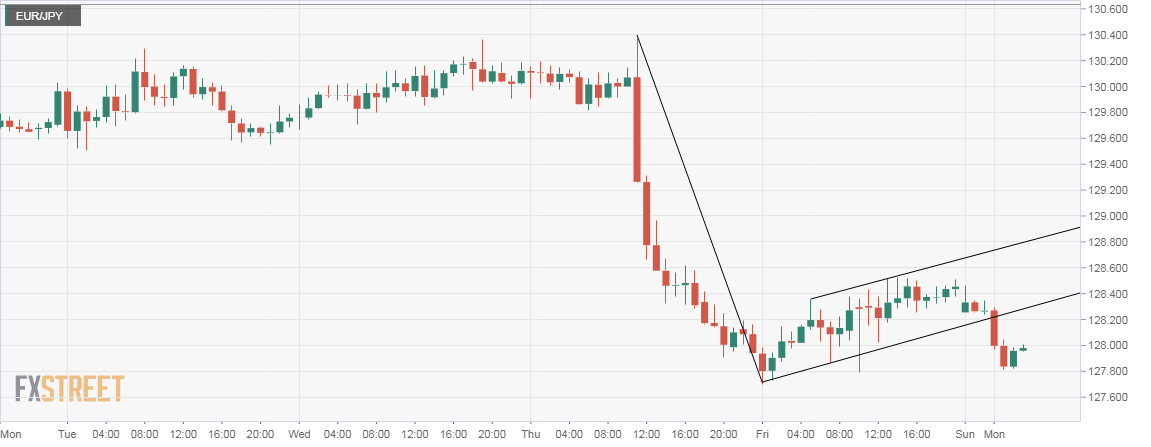
Spot Rate: 127.95
Daily High: 128.42
Daily Low: 127.82
Trend: Bearish
Resistance
R1: 128.42 (daily high)
R2: 128.82 (5-day moving average)
R3: 129.04 (10-day moving average)
Support
S1: 127.70 (previous day's low)
S2: 127.49 (50% Fib R of May 29 low - June 14 high)
S3: 126.81 (61.8% Fib R of May 29 low - June 14 high)