6 Feb 2023
USD Index Price Analysis: Recovery looks firm near term
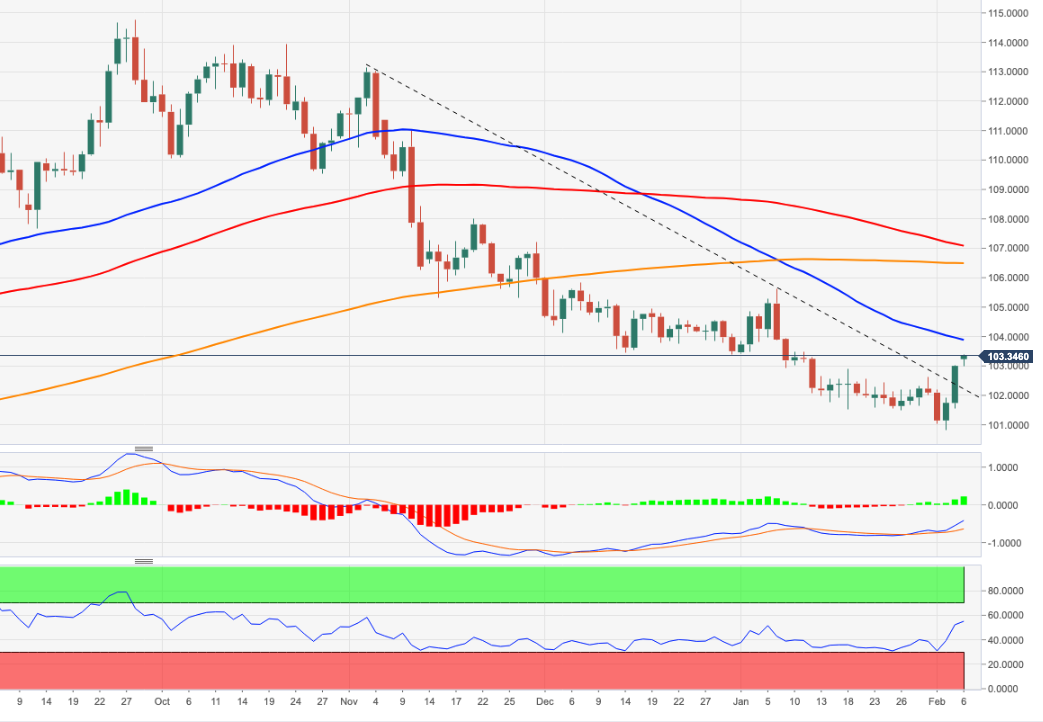
- The index pushes higher and consolidates the breakout of 103.00,
- There is an interim hurdle at the 55-day SMA at 103.88.
The march north in the index appears unabated and now extends the recovery from last week’s lows near 100.80 to the area well above the 103.00 yardstick.
DXY surpasses the 3-month line and this allows for the continuation of the upside momentum to, initially, the temporary 55-day SMA, today at 103.88. Further up, there are no relevant hurdles until the 2023 top at 105.63 (January 6).
In the longer run, while below the 200-day SMA at 106.45, the outlook for the index remains negative.
DXY daily chart