USD/CAD Price Analysis: Bulls and bears battle it out at key structure
- USD/CAD is making moves to the upside, but bears are lurking.
- Bulls eye a longer-term target beyond 1.4000.
We have seen USD/CAD break out of a symmetrical triangle on the daily chart and the focus is on the upside while the price continues to ride weekly trendline support.,
A correction at this juncture into prior highs near 1.3580, could act as support offering a discount to the bulls seeking a run on liquidity towards 1.3800/25 stops in a continuation of the short squeeze.
USD/CAD weekly charts
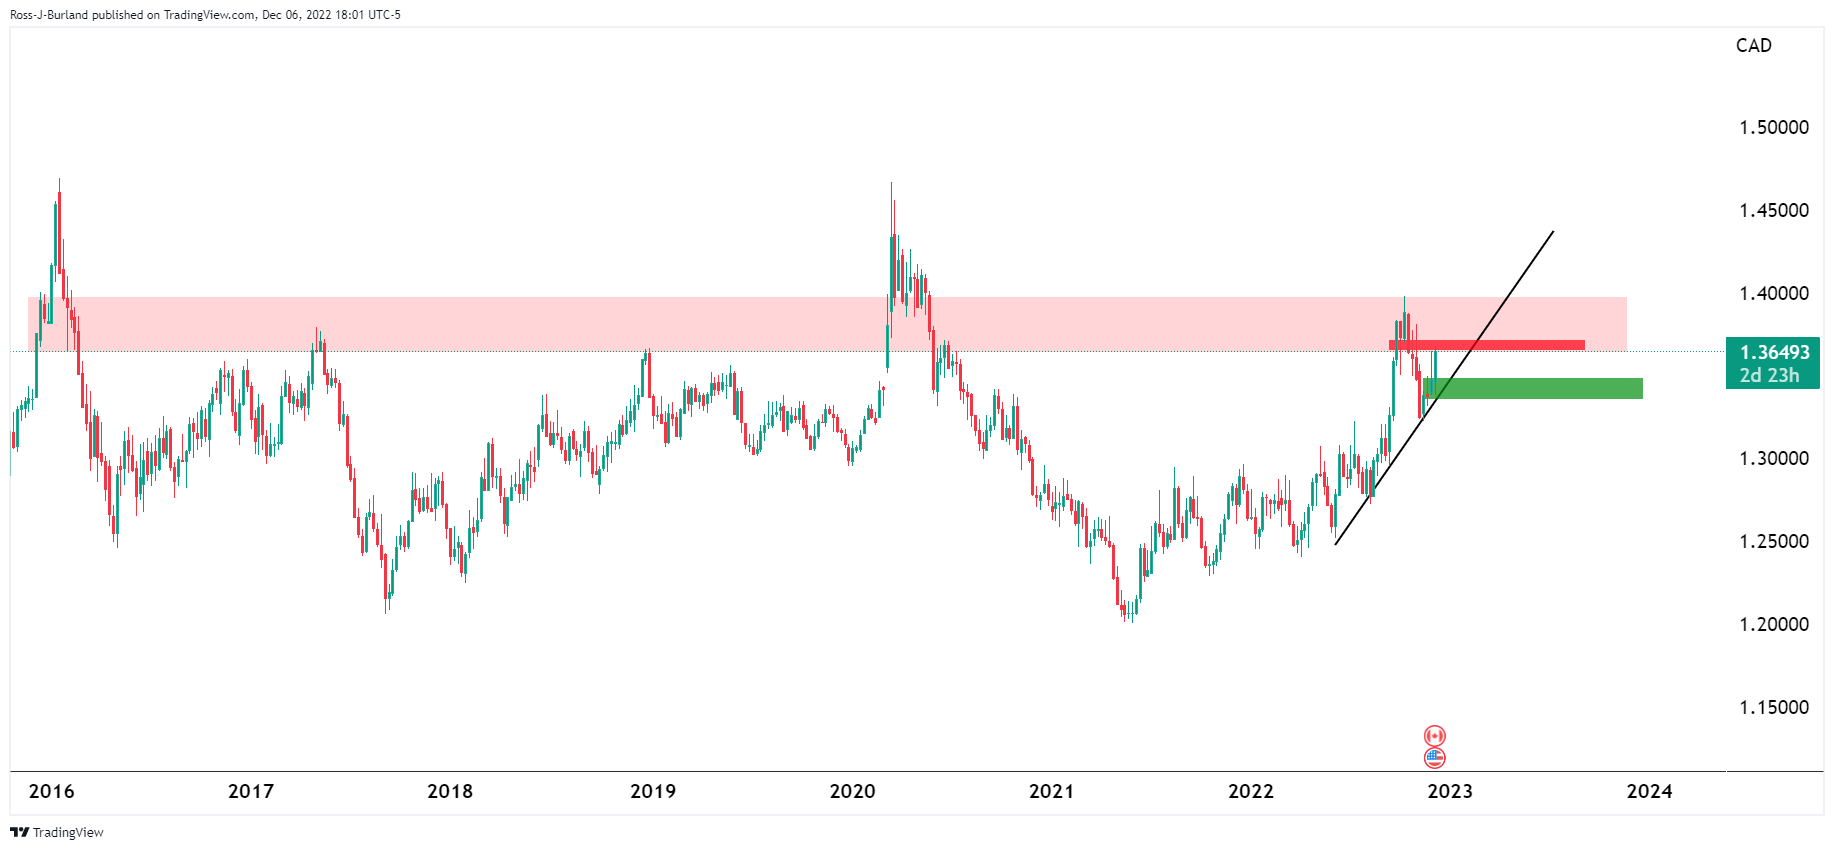
USD/CAD is in an uptrend with eyes on a break of 1.4000. However, there is a long way to go until the bulls are out of the woods as the following charts will illustrate:
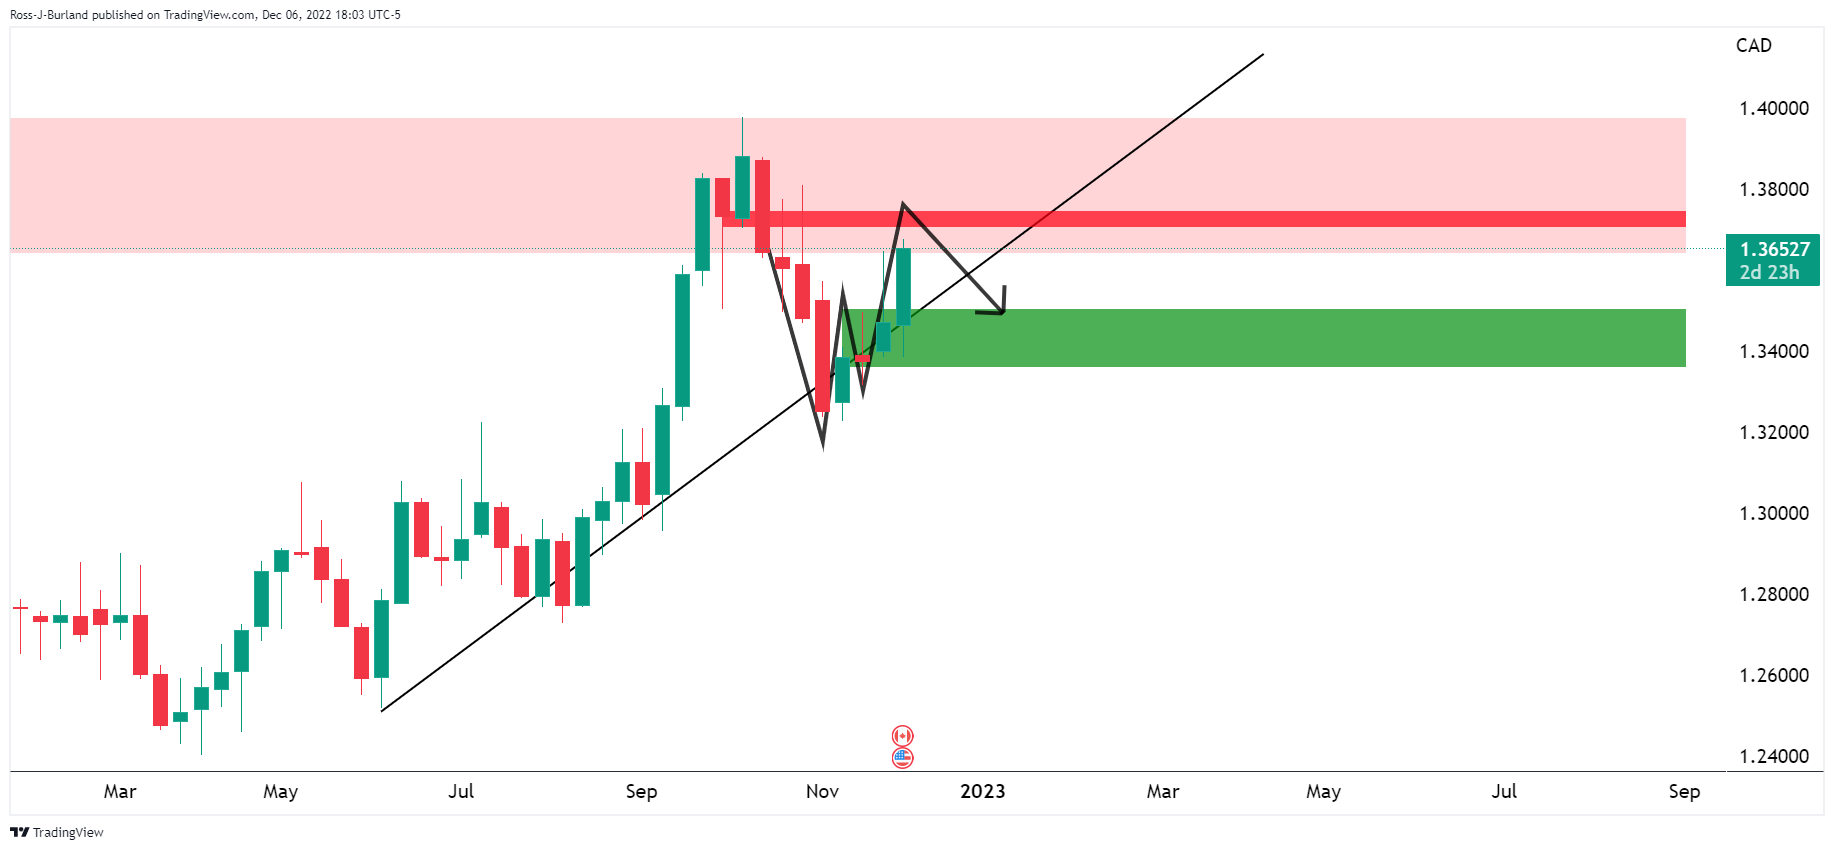
There are conflicting patterns on the weekly chart, as we zoom in.
We have a W formation, on the chart above, and an M pattern on the chart below.
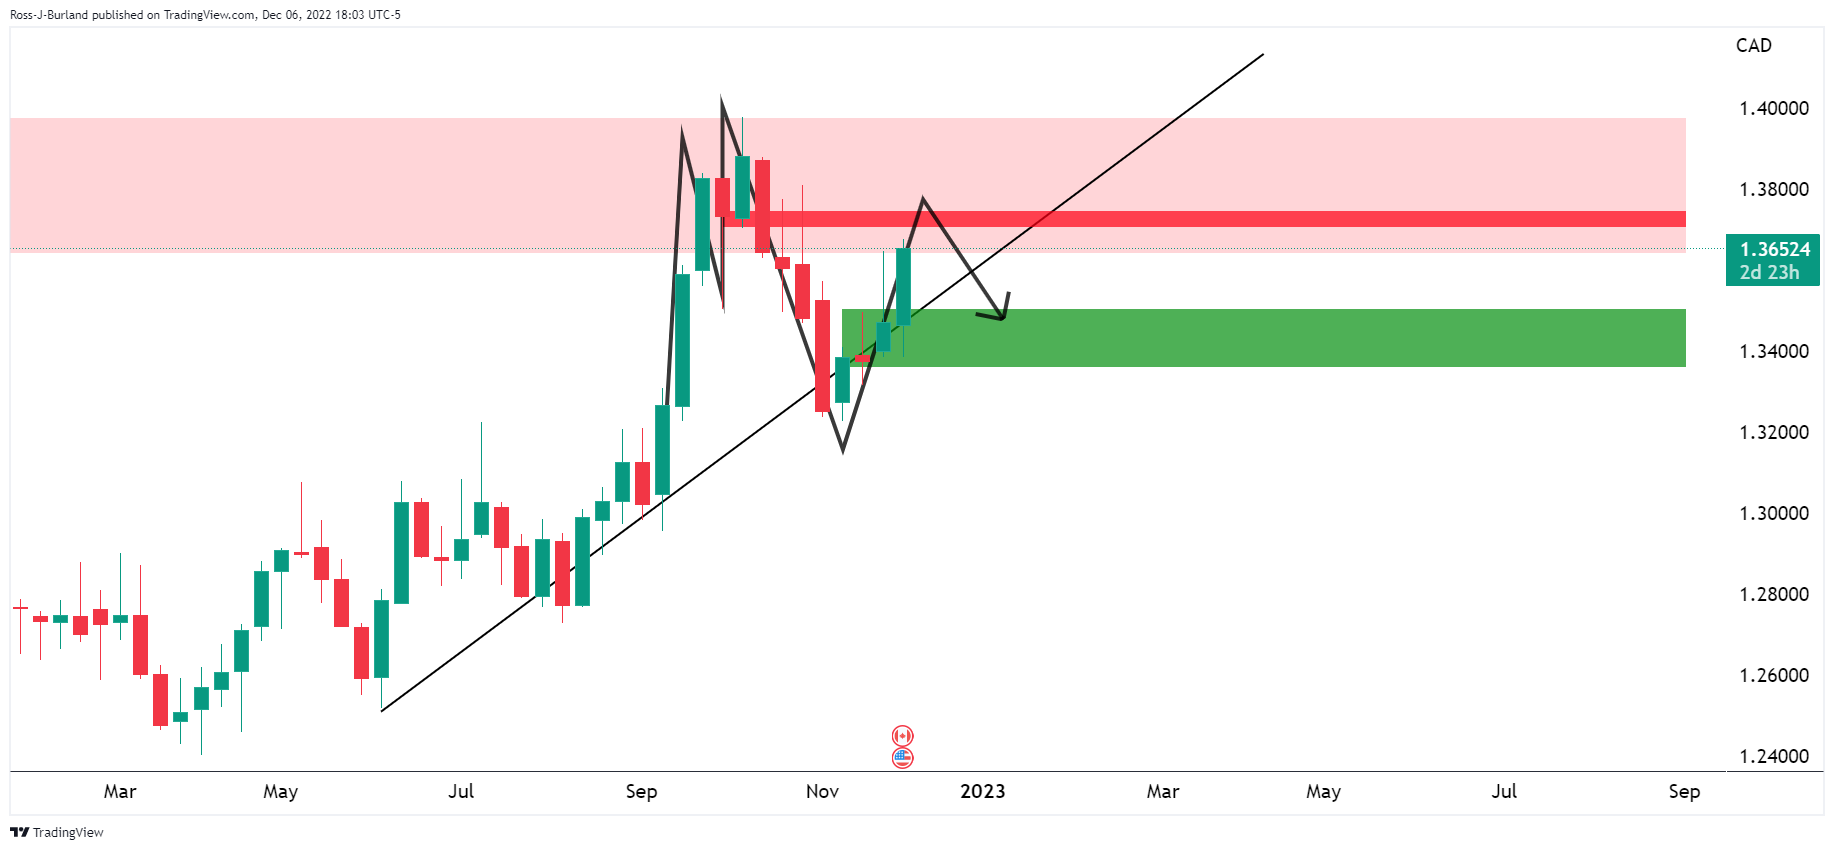
Given the price has rallied towards the neckline of the M-formation, the path of least resistance could now be to the downside for the near term.
USD/CAD daily chart
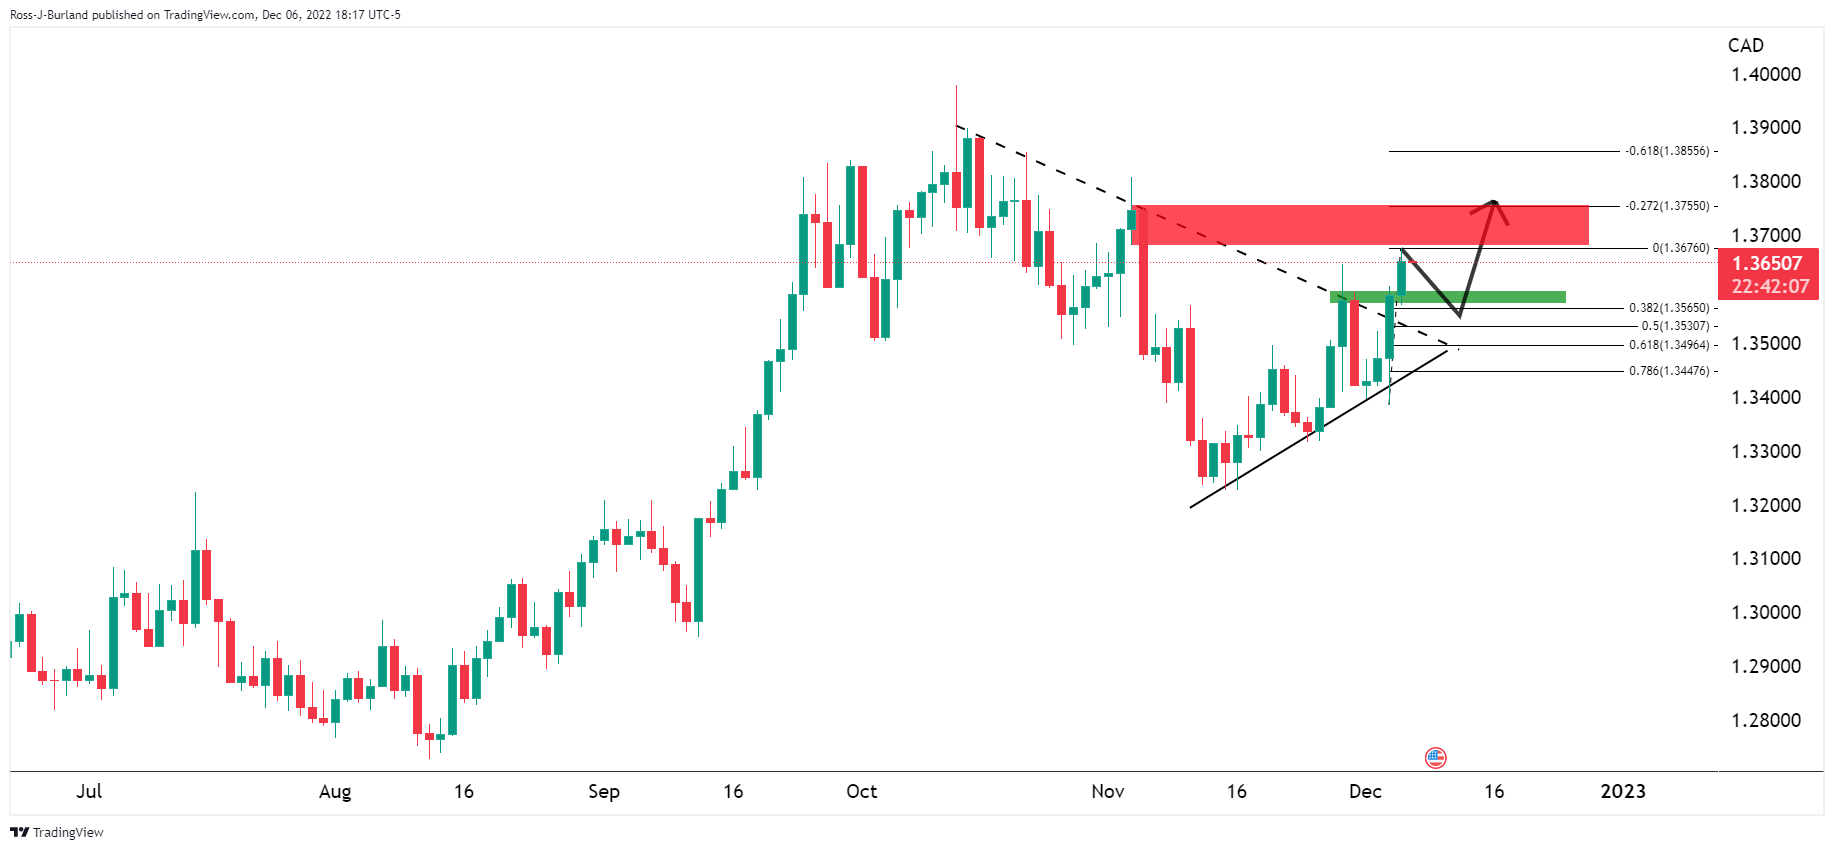
We have seen USD/CAD break out of the triangle meeting the 1.3650s. A correction at this juncture into prior highs near 1.3580, could act as support offering a discount to the bulls seeking a run on liquidity towards 1.3800/25 stops in a continuation of the short squeeze.